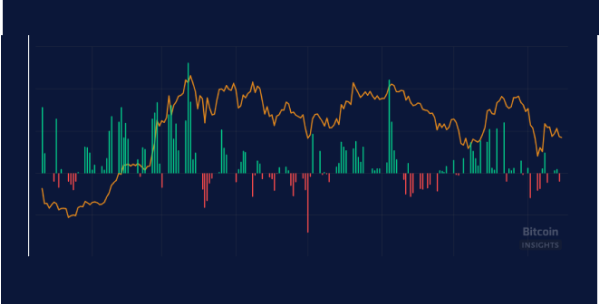
Due to the early stage of broader adoption, digital asset market are inherently volatile. As such, individuals tend to let their emotions dictate their actions. The fear and greed index chart seeks to capture this by providing investors and bitcoin traders with information on whether the market sentiment has swung too far in one direction.
The assumption is that: – If the fear and greed chart is too greedy (green indicator) then there is likely a short term downward price correction ahead. – if the fear and greed chart is too fearful (red indicator) then there is likely a short term upward price correction ahead.
A score of 0 is representative of “Extreme Fear” in the wider digital asset market, while a score of 100 denotes “Extreme Greed”.
FAQs
What is the Fear and Greed Index?
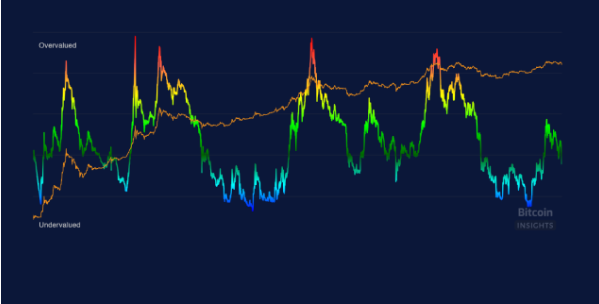
The Fear and Greed Index is a sentiment indicator for the broader “crypto” ecosystem. It provides investors with information on whether the market is greedy (overbought) or fearful (oversold).
How is the Fear and Greed Index calculated?
The Fear and Greed Index is based on a variety of factors, namely:
Volatility (which makes up 25% of the index)
Market Momentum (which makes up 25% of the index)
Social Media (which makes up 25% of the index)
Surveys (which makes up 15% of the index)
These factors are aggregated into the index and then placed on a scale of 0-100, with 0 representing extreme fear and 100 representing extreme greed.
Why is the Fear and Greed Index helpful to investors?
The Fear and Greed Index is useful because it can provide insight into whether the market is overly optimistic or pessimistic in the short term. The market spends most time fluctuating between extreme values, and as such when the index enters these ranges it may represent an optimal risk-adjusted opportunity to either acquire more Bitcoin or take profits.
DISCLAIMER
This information is for educational purposes only. Any Information found on this site is not to be considered financial advice.